Sea ice tracking at record low levels
After a period of rapid ice loss through the first half of June, sea ice extent is now slightly below 2010 levels, the previous record low at this time of year. Sea level pressure patterns have been favorable for the retreat of sea ice for much of the past month.
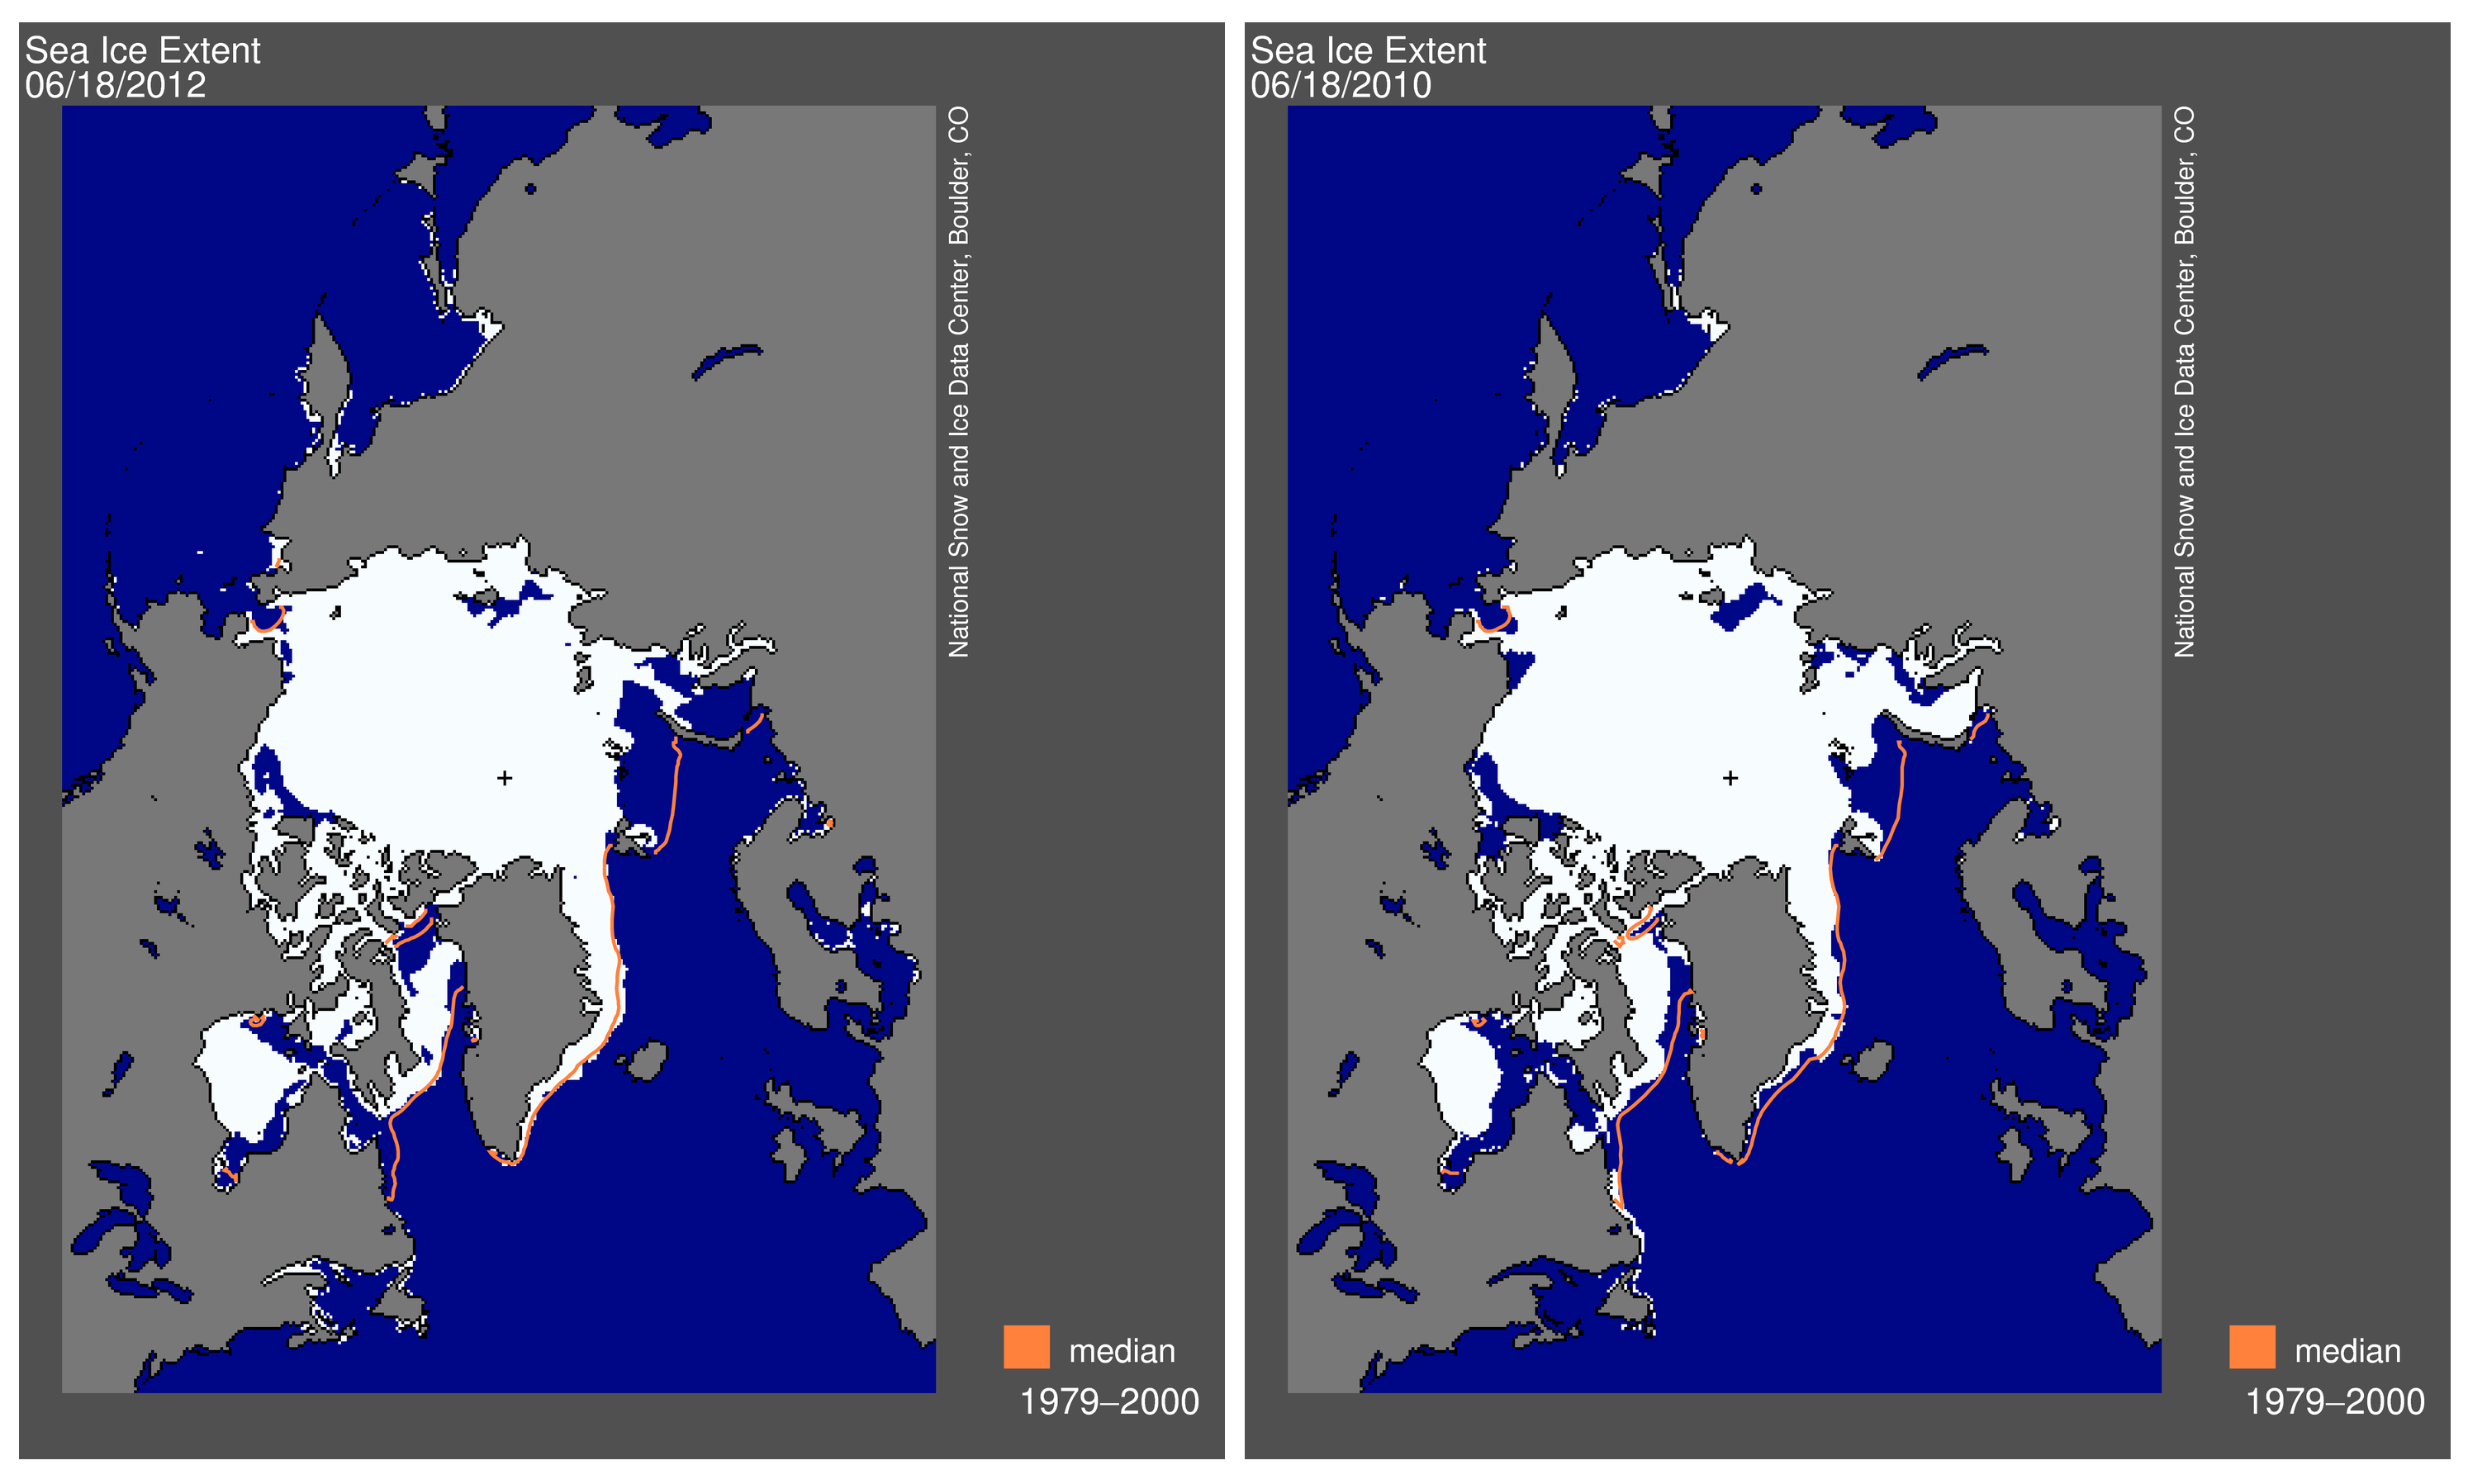
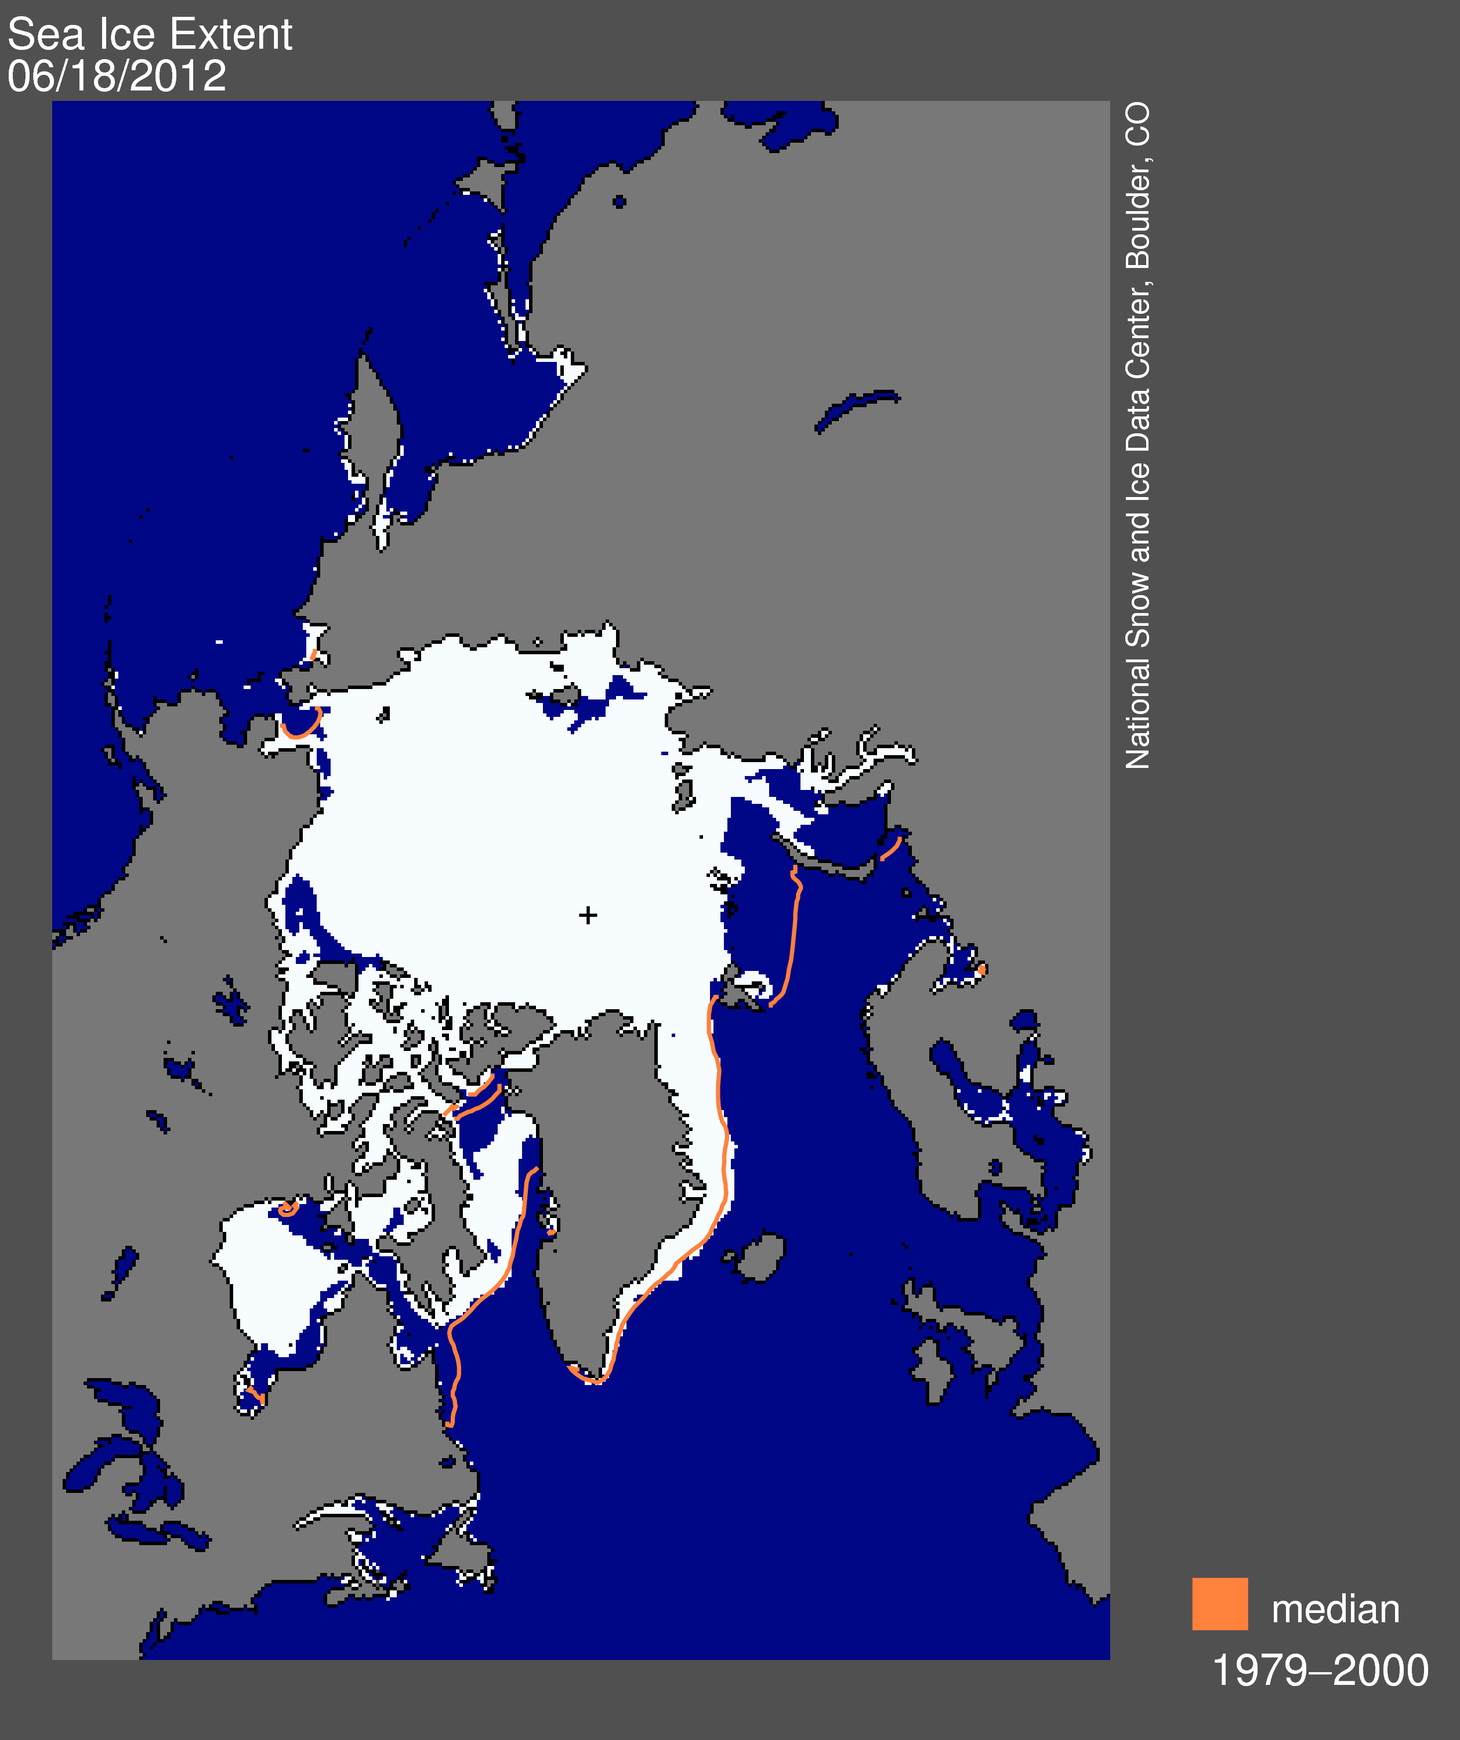
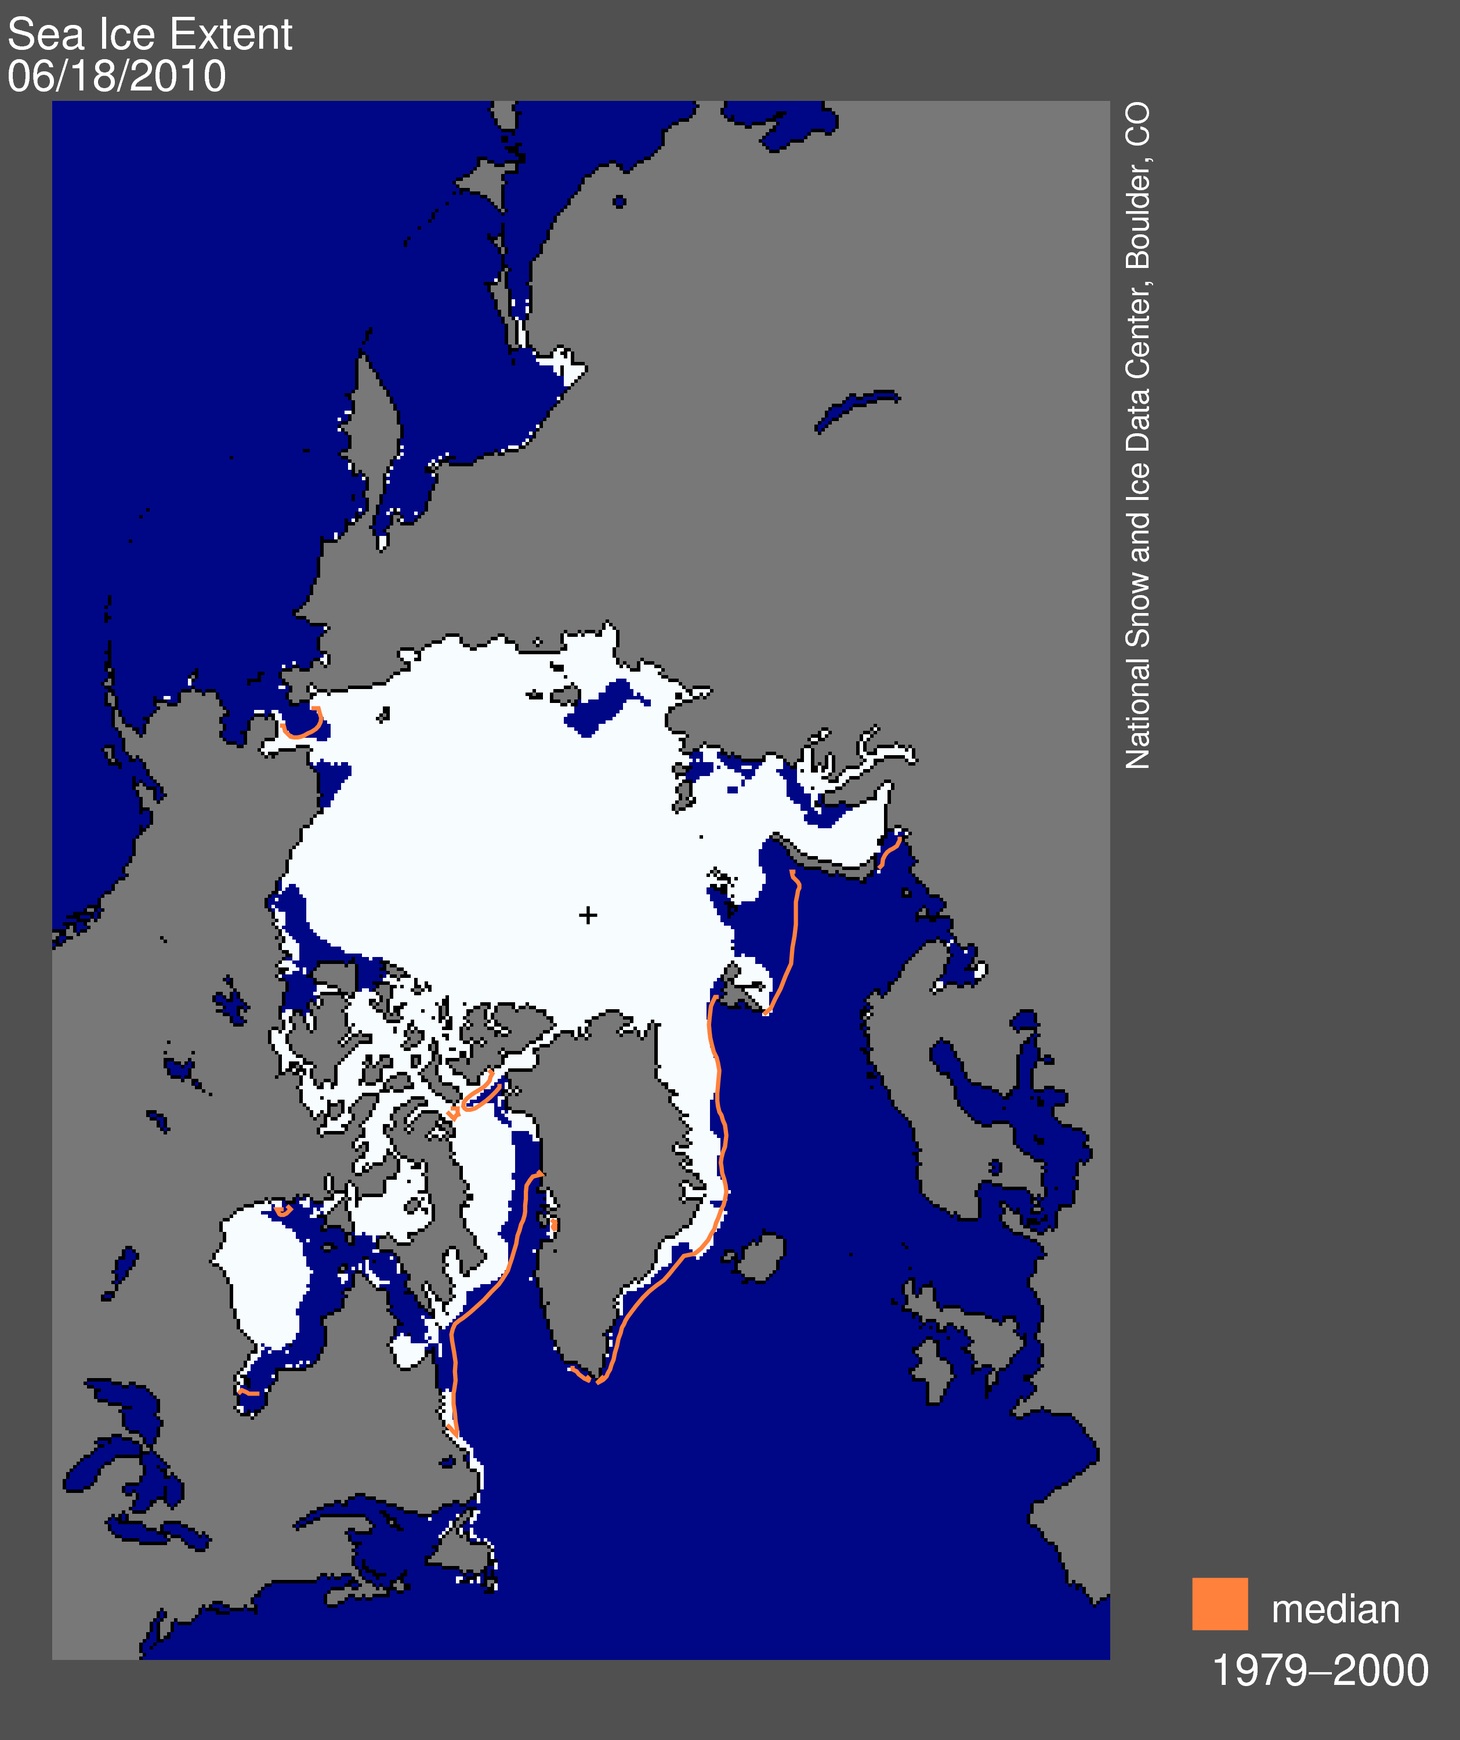
Figure 1. Arctic sea ice extent for 18 June 2012 (left) was 10.62 million square kilometers (4.10 million square miles), 31,000 square kilometers (12,000 square miles) below the same day in 2010 (right). The orange line shows the 1979 to 2000 median extent for that month. The black cross indicates the geographic North Pole. Sea Ice Index data. About the data. Credit: National Snow and Ice Data Center
High-resolution images: Figure 1a, Figure 1b
High-resolution images: Figure 1a, Figure 1b
Overview of conditions
On June 18, the five-day average sea ice extent was 10.62 million square kilometers (4.10 million square miles). This was 31,000 square kilometers (12,000 square miles) below the same day in 2010, the record low for the day and 824,000 square kilometers (318,000 square miles) below the same day in 2007, the year of record low September extent.
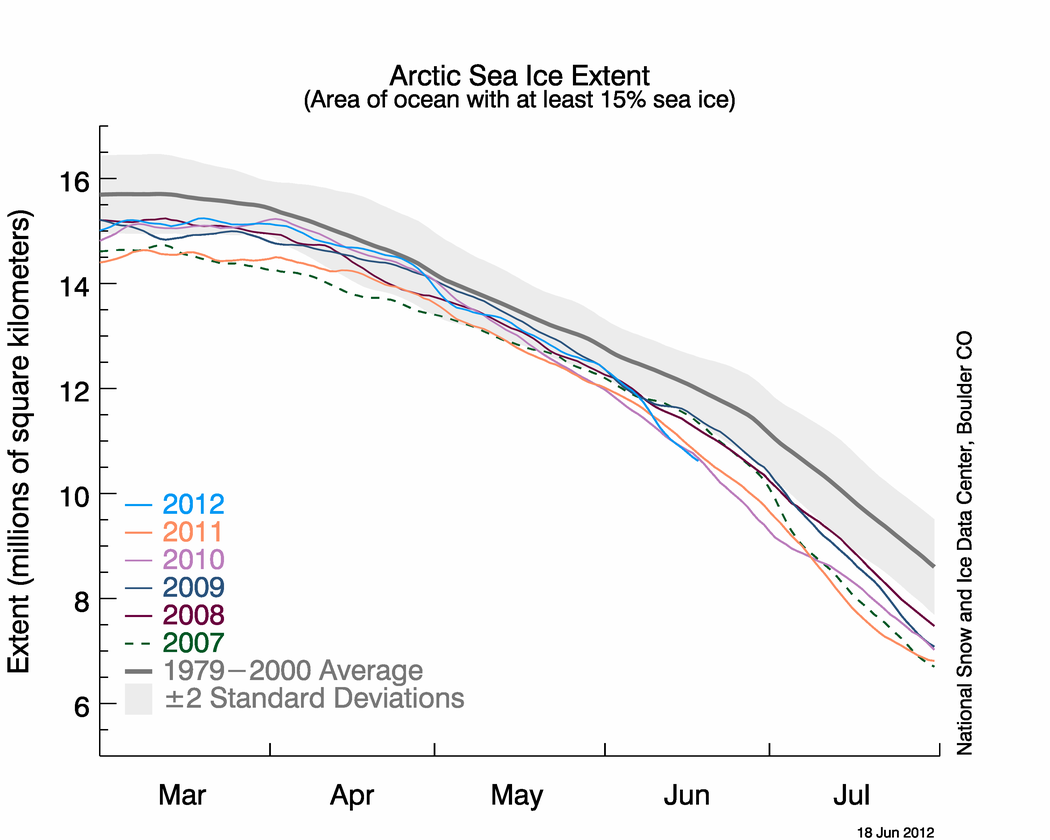
Figure 2. The graph above shows Arctic sea ice extent as of June 18, 2012, along with daily ice extent data for the previous four years. 2012 is shown in blue, 2011 in orange, 2010 in pink, 2009 in navy, 2008 in purple, and 2007 in green. The gray area around the average line shows the two standard deviation range of the data. Sea Ice Index data. Credit: National Snow and Ice Data Center. High-resolution image
Conditions in context
The main contributors [huh? no, the main effects of warmer sea and air temperatures and the formation of late and thin first-year ice] to the unusually rapid ice loss to this point in June are the disappearance of most of the winter sea ice in the Bering Sea, rapid ice loss in the Barents and Kara Seas, and early development of open water areas in the Beaufort and Laptev Seas north of Alaska and Siberia. Recent ice loss rates have been 100,000 to 150,000 square kilometers (38,600 to 57,900 square miles) per day, which is more than double the climatological rate.
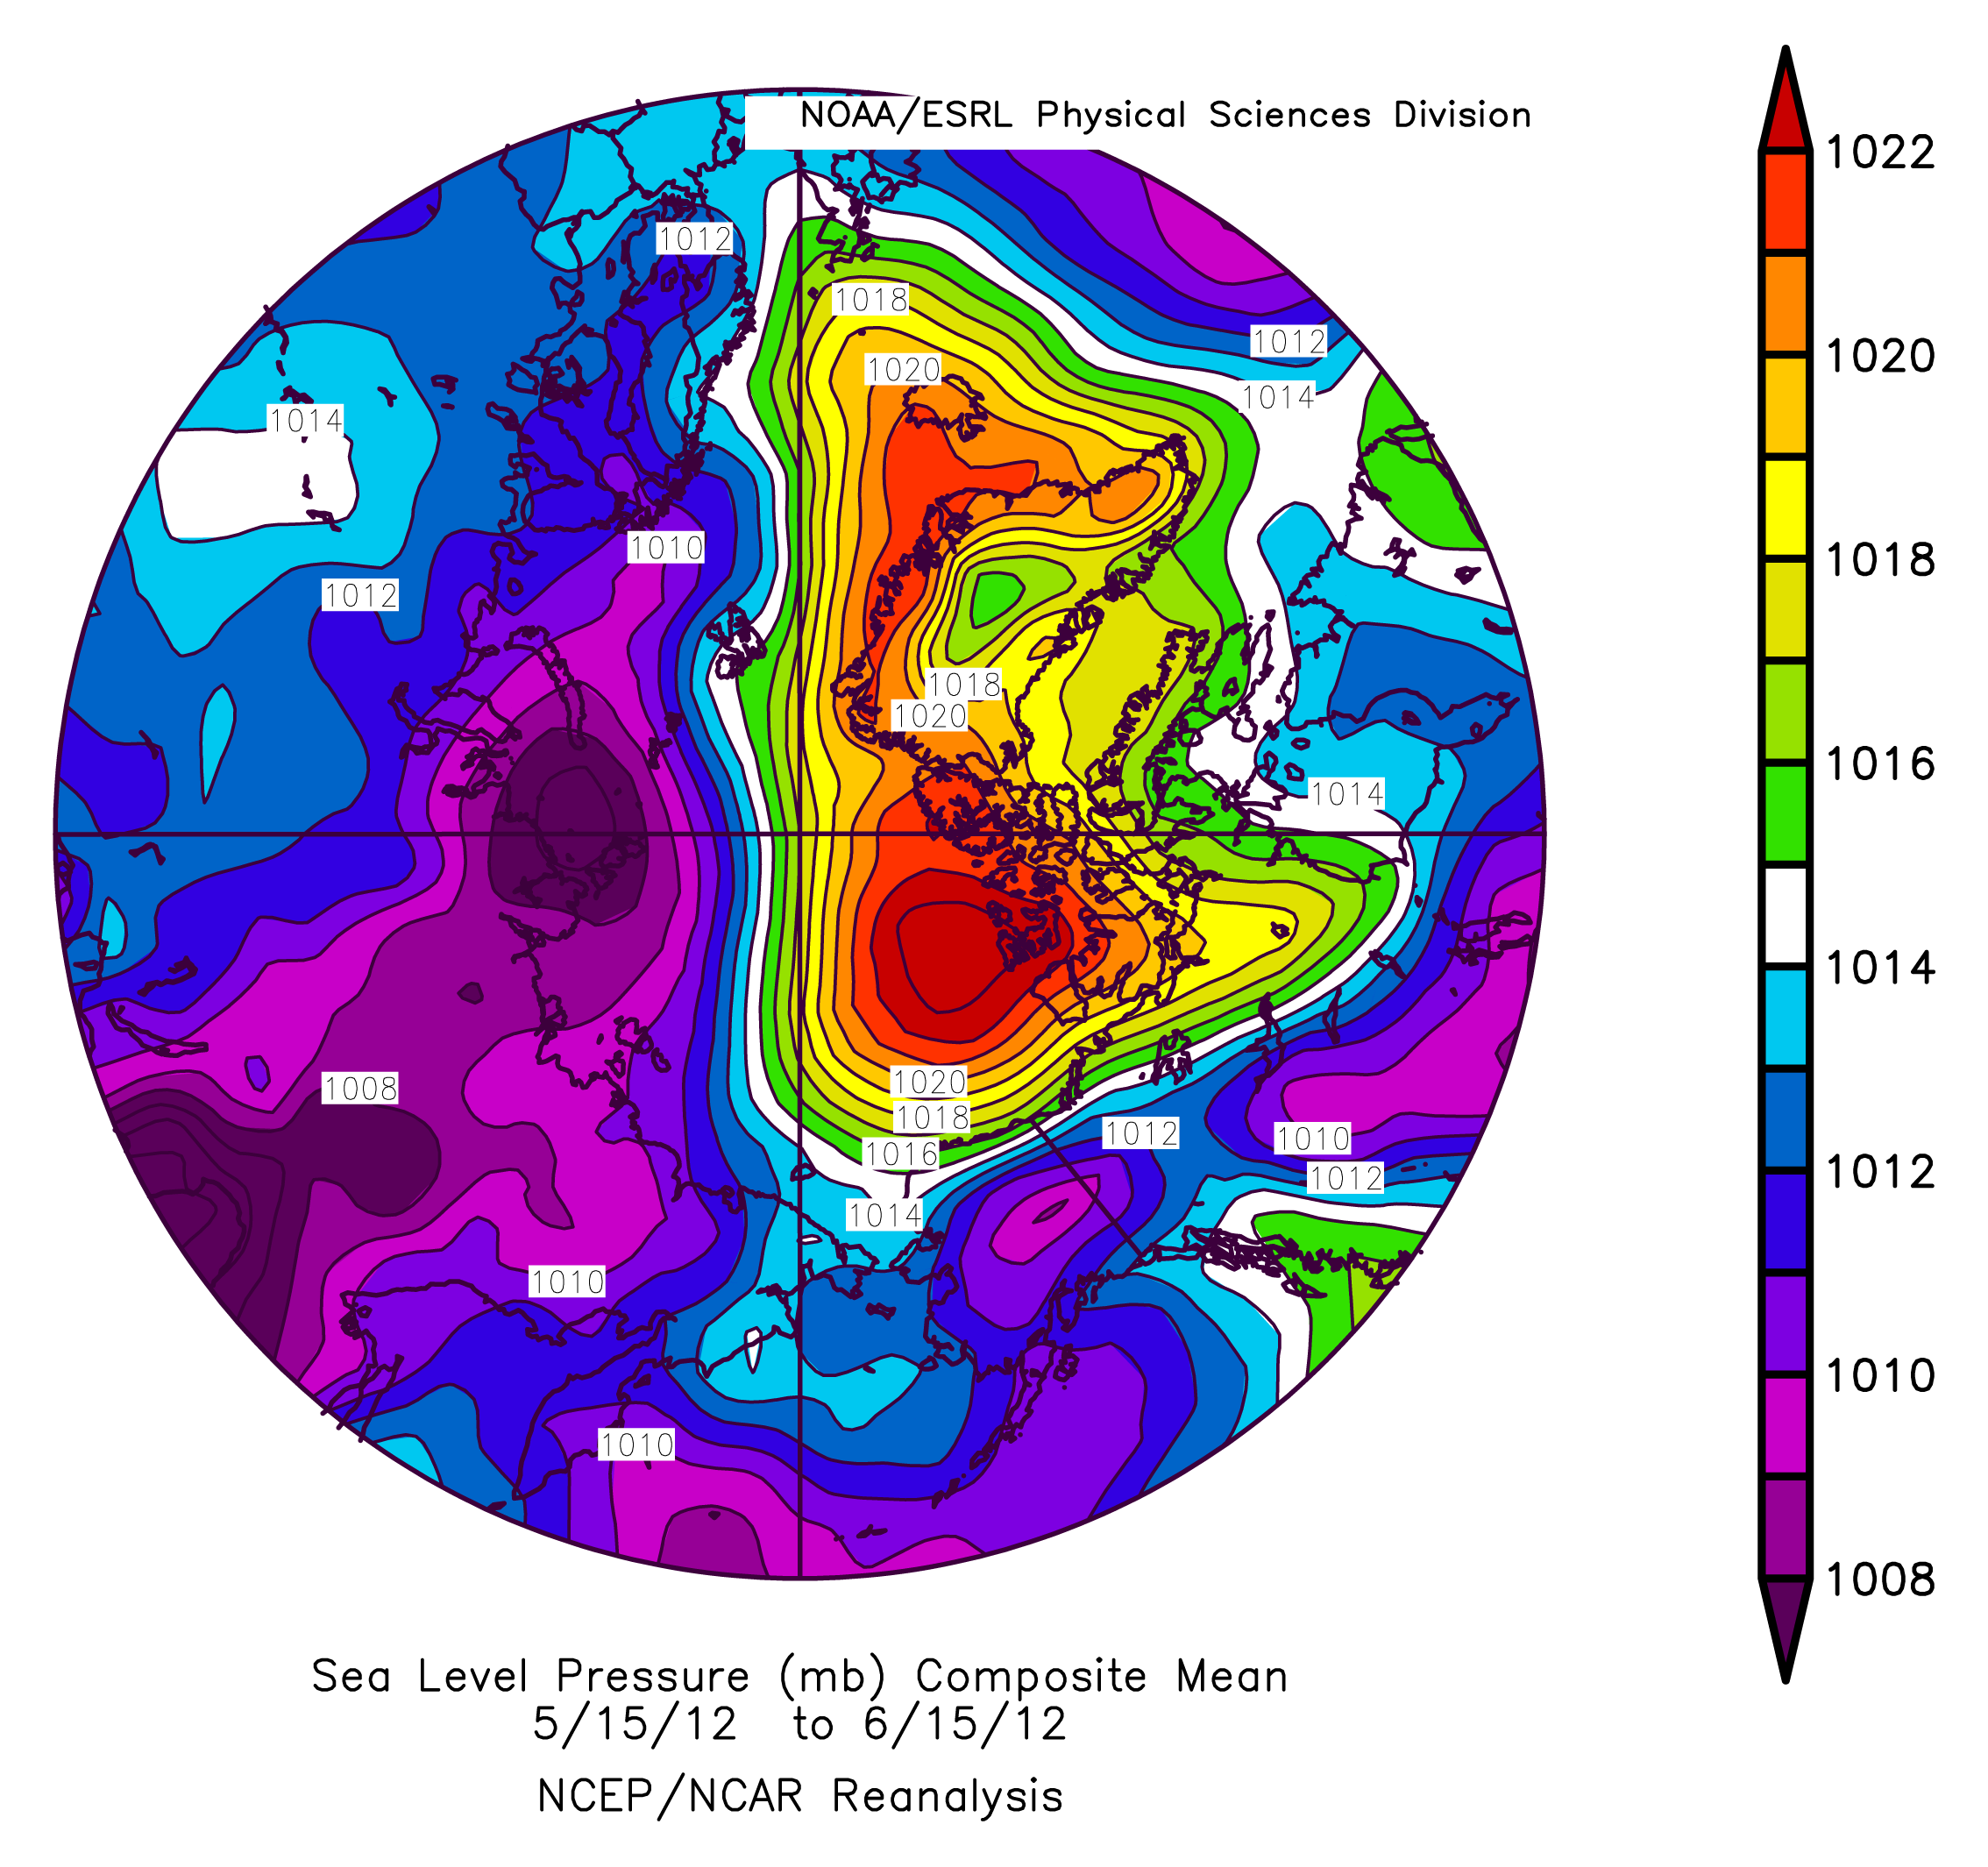
Figure 3: This map of mean sea level pressure from 15 May 2012 to 15 June 2012 shows a pattern of high pressure over the Beaufort Sea and a pattern of low pressure over the Laptev Sea, conditions favorable to summer ice loss. Credit: NSIDC courtesy NOAA/ESRL PSD. High-resolution image
Sea level pressure favors the advection of ice
A pattern of high pressure over the Beaufort Sea and low pressure over the Laptev Sea has been present for the past few weeks. This pattern is favorable for summer ice loss, by advecting warm winds from the south (in eastern Asia) to melt the ice and transport it away from the coastlines in Siberia and Alaska. The high pressure over the Beaufort leads to generally clear skies, and temperatures are now above freezing over much of the Arctic pack. Snow cover in the far north is nearly gone, earlier than normal, allowing the coastal land to warm faster.
Early melt onset, and clear skies near the solstice are favorable conditions for more rapid melting, and warming of the ocean in open-water areas. The persistence of this type of pressure pattern throughout summer 2007 was a major factor toward causing the record low September extent that year. Conversely, in 2010, the patterns were not as favorable for loss of ice and the seasonal decline slowed later in the summer, and the extent did not approach the record low levels of 2007.
While these patterns and conditions have looked similar to 2007, over the last couple days the high pressure pattern over the Beaufort Sea has broken down. And while the extent is at a record low for the date, it is still early in the melt season. Changing weather patterns throughout the summer will affect the exact trajectory of the sea ice extent through the rest of the melt season.


No comments:
Post a Comment